
Announcement
Oneida County: Enters 2025 with strong economic fundamentals, low unemployment, rising employment and business creation, and robust consumer activity
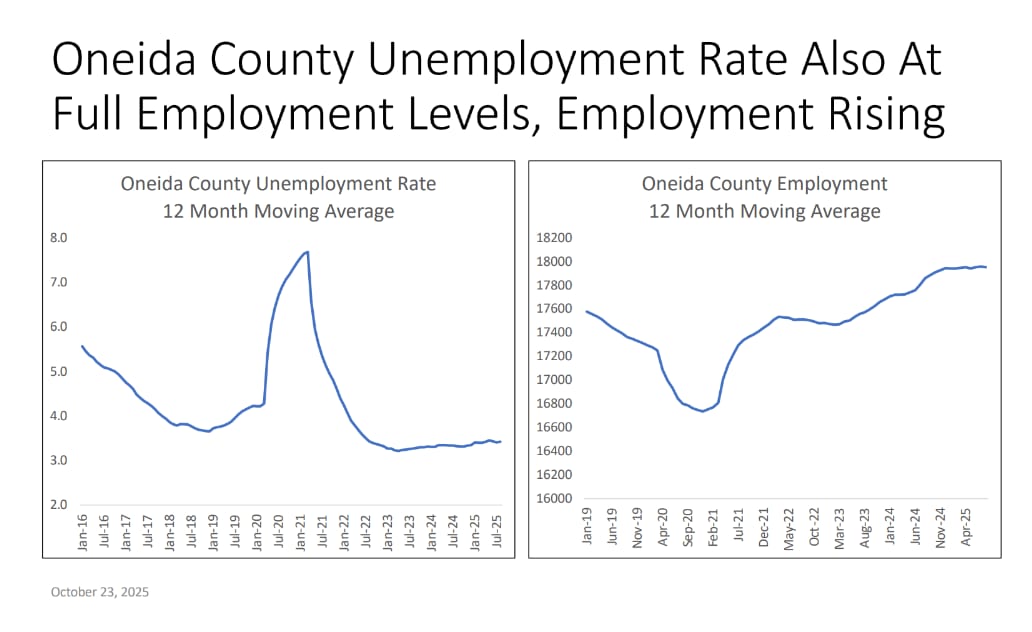
Oneida County enters 2025 with strong economic fundamentals: low unemployment, rising employment and business creation, and robust consumer activity.
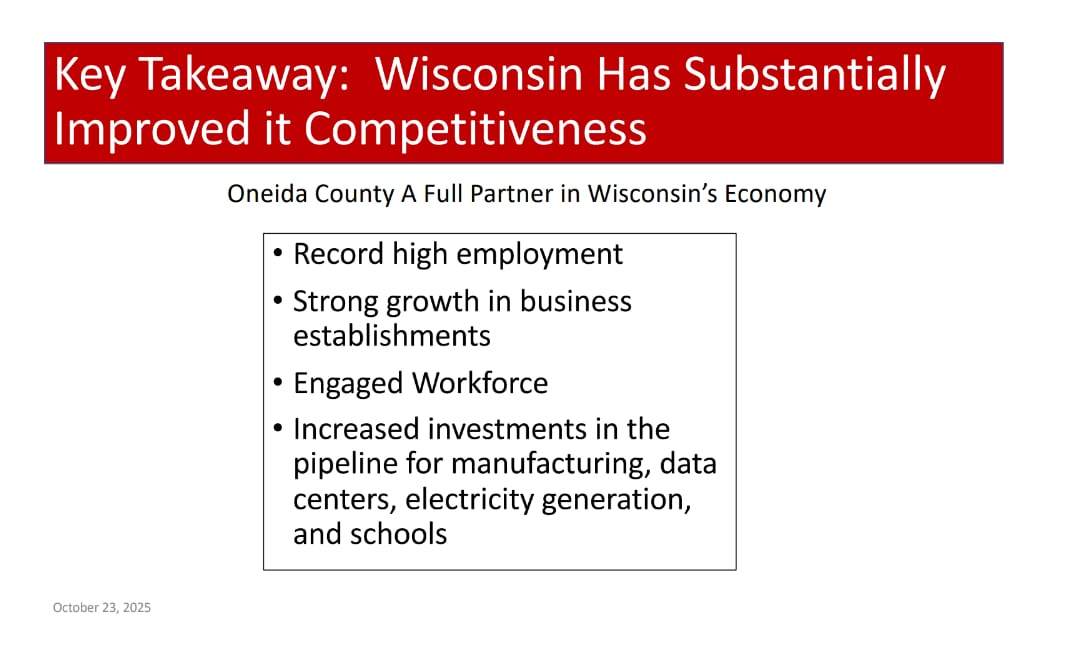
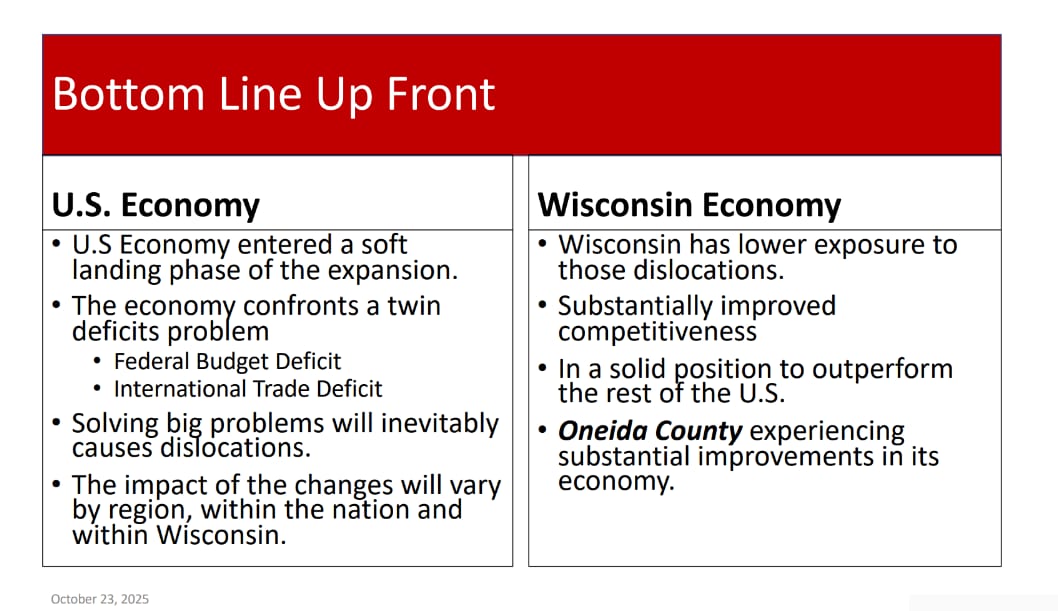
Economic Overview 2025 The U.S. economy has entered a “soft landing” phase, slower but steady growth following the pandemic expansion. Despite national fiscal and trade deficits, Wisconsin and Oneida County remain economically resilient, outperforming national averages in employment, investment, and fiscal stability.
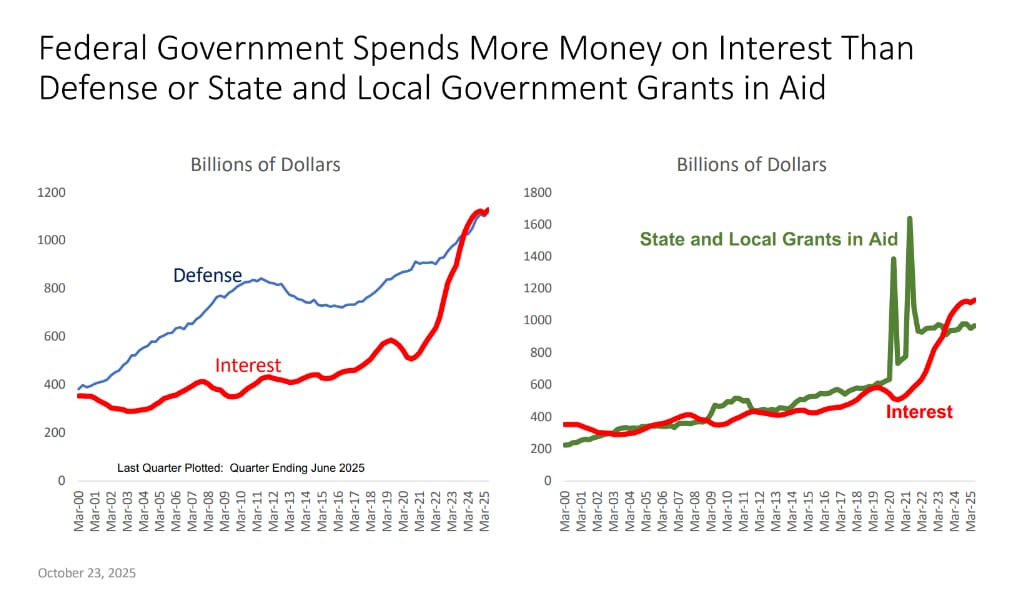
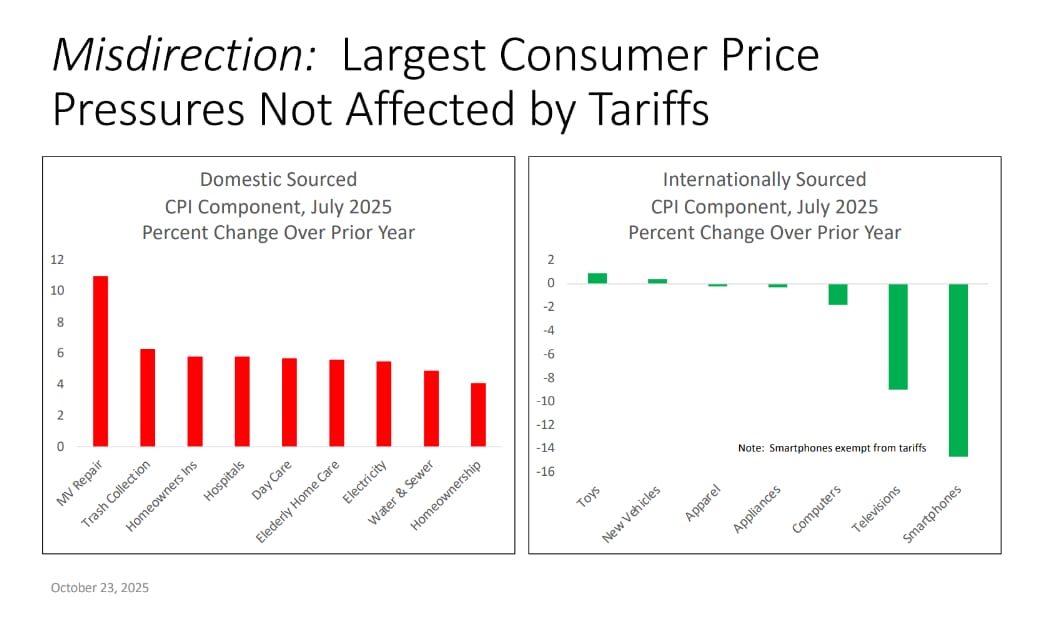
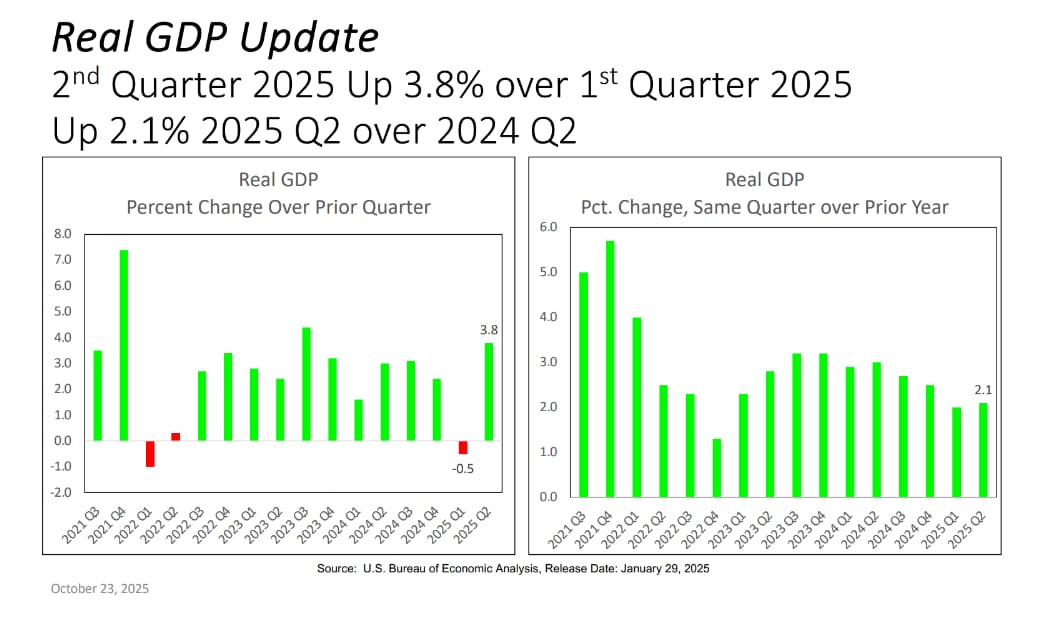
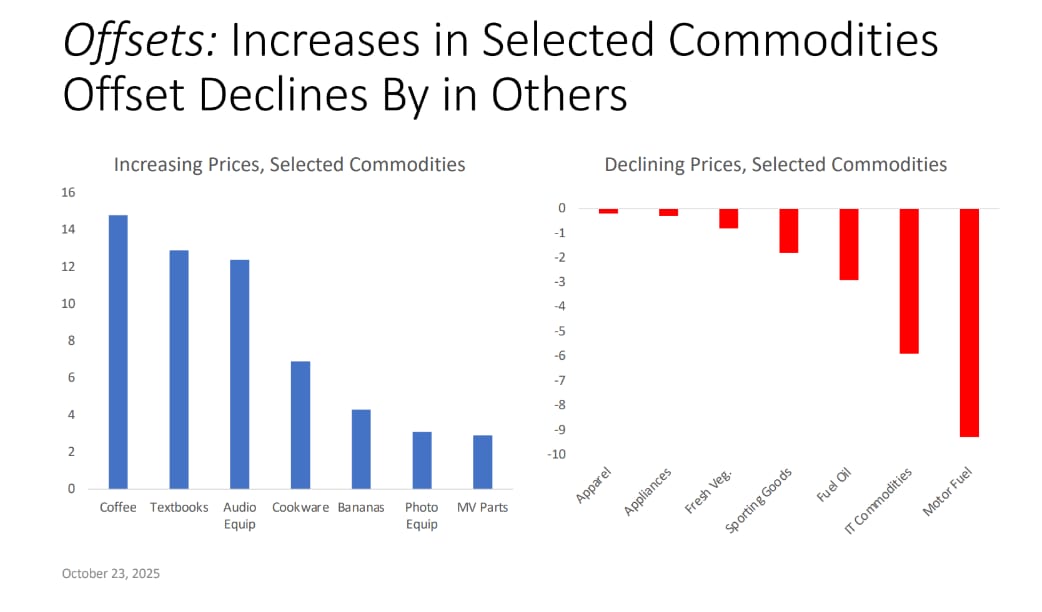
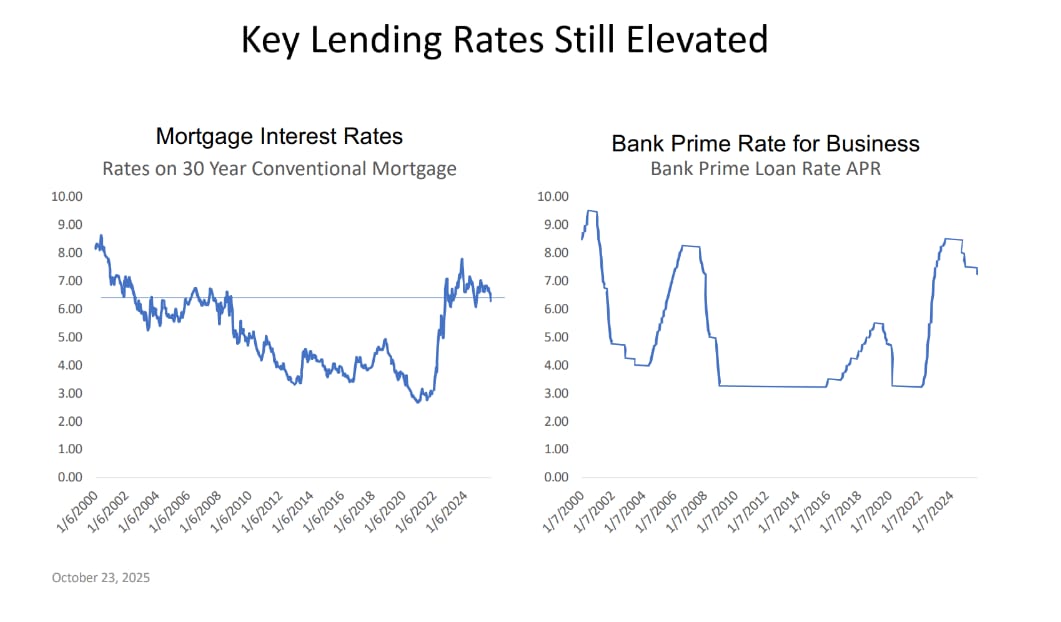
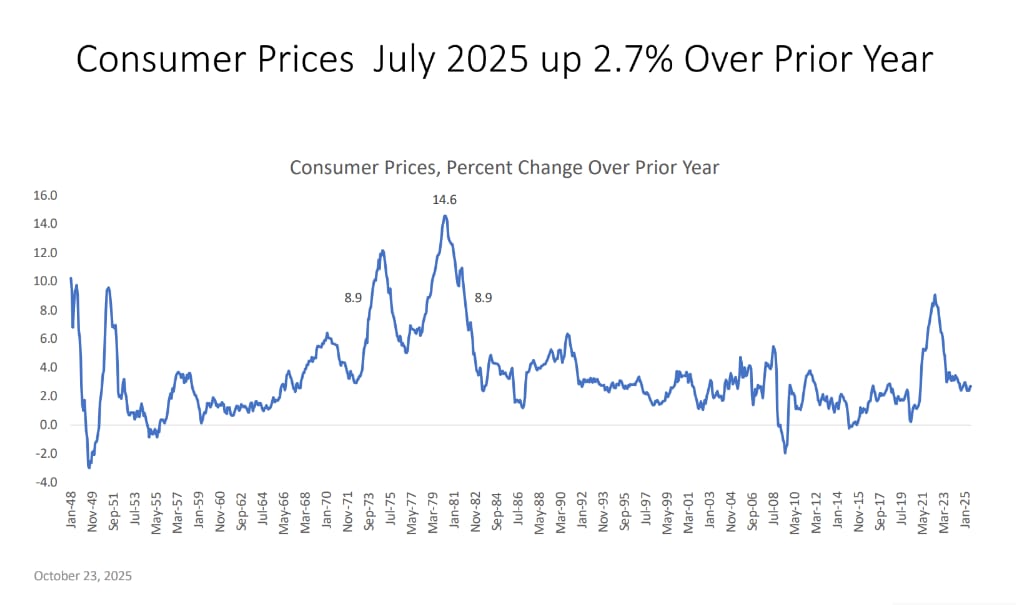
National Context • GDP Growth: U.S. real GDP grew 3.8% in Q2 2025 (quarter-over-quarter) and 2.1% from a year earlier. • Unemployment: The U.S. unemployment rate stabilized around 4.3%, with job openings and hiring back to pre-pandemic levels. Layoffs remain below average. • Inflation: Consumer prices increased 2.7% year-over-year (July 2025), indicating controlled inflation. Import prices fell early in 2025. • Interest Rates: Despite a modest Federal Reserve rate cut in September 2025, inflation-adjusted rates remain restrictive. Mortgage and lending rates continue to constrain borrowing. • Federal Deficit: The federal budget deficit stands at $2 trillion, with debt service costs now exceeding defense spending. Efforts to reduce deficits include increased tariffs and potential spending cuts.
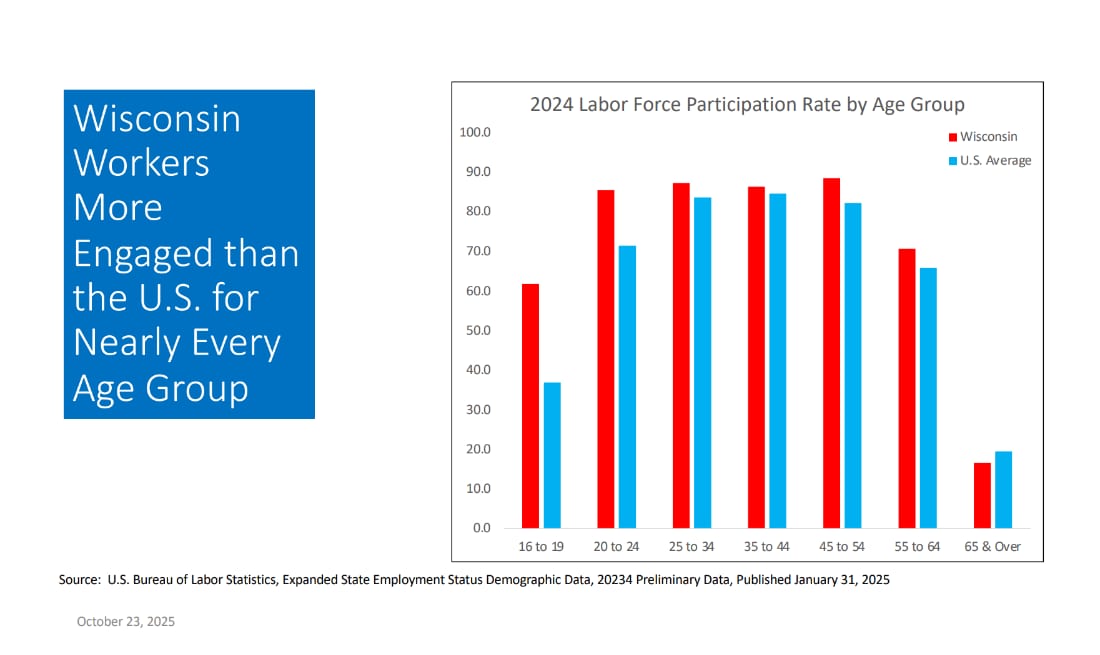
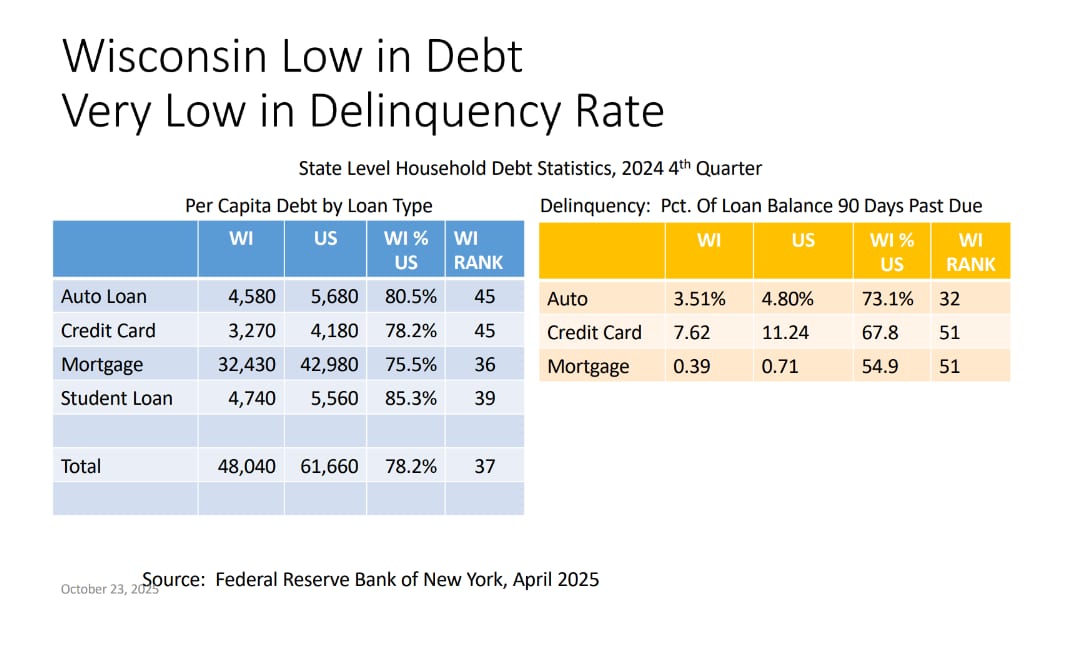
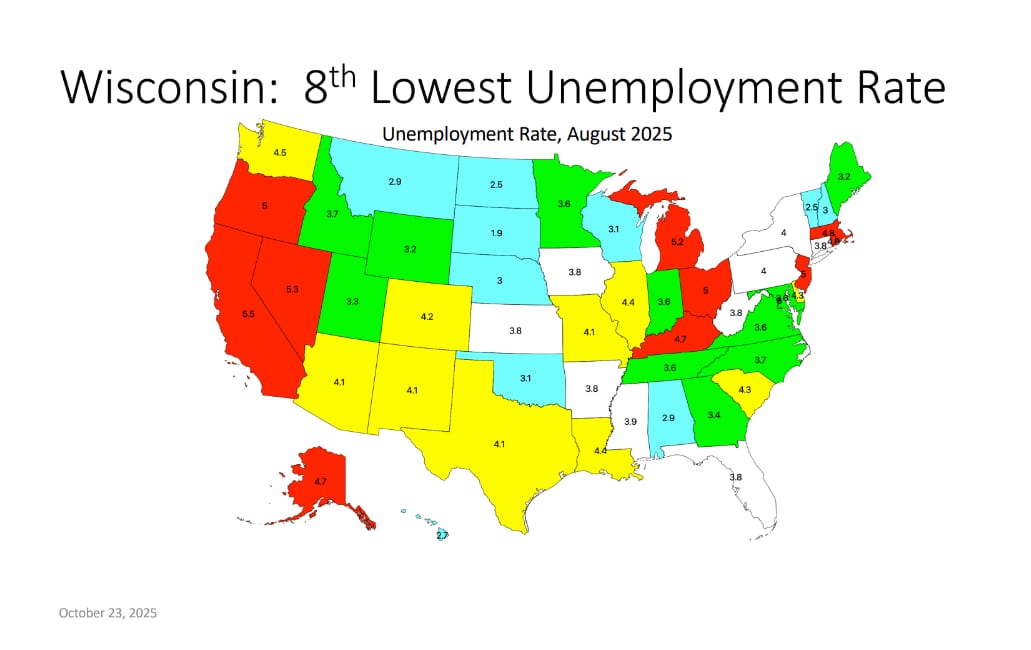
Wisconsin Economy • Employment: As of August 2025, Wisconsin added 23,000 jobs year-over-year, with unemployment near full-employment levels (~3%). • Labor Force Participation: Among the highest in the U.S., Wisconsin ranks 7th nationally for participation of workers aged 25–54. • Population: The state continues to experience net in-migration, particularly from neighboring states, reversing earlier population losses. • Inflation and Debt: Wisconsin households hold 22% less debt than the U.S. average and have the lowest delinquency rates nationwide.
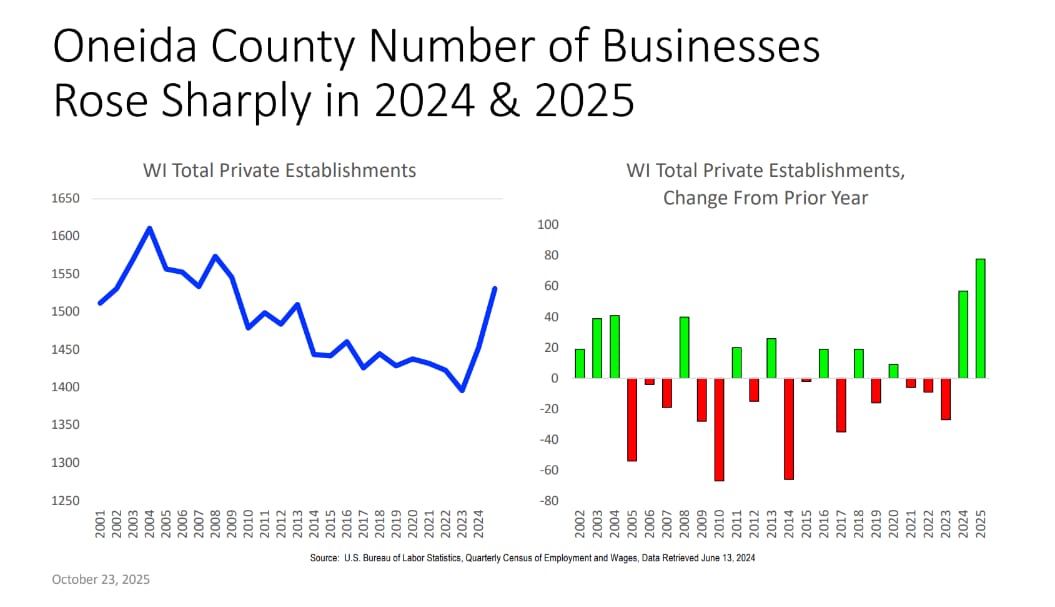
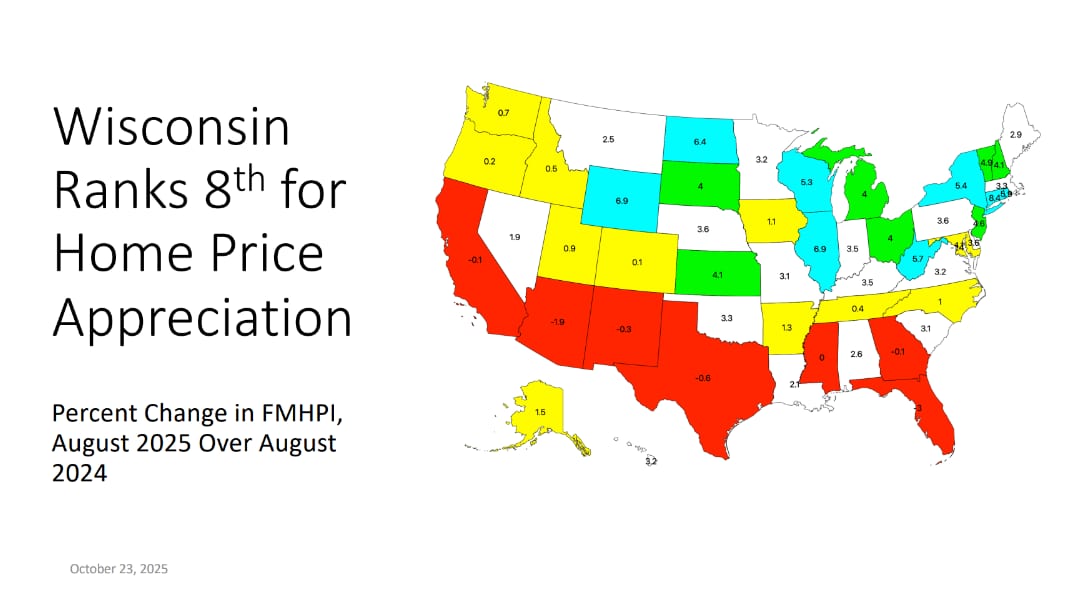
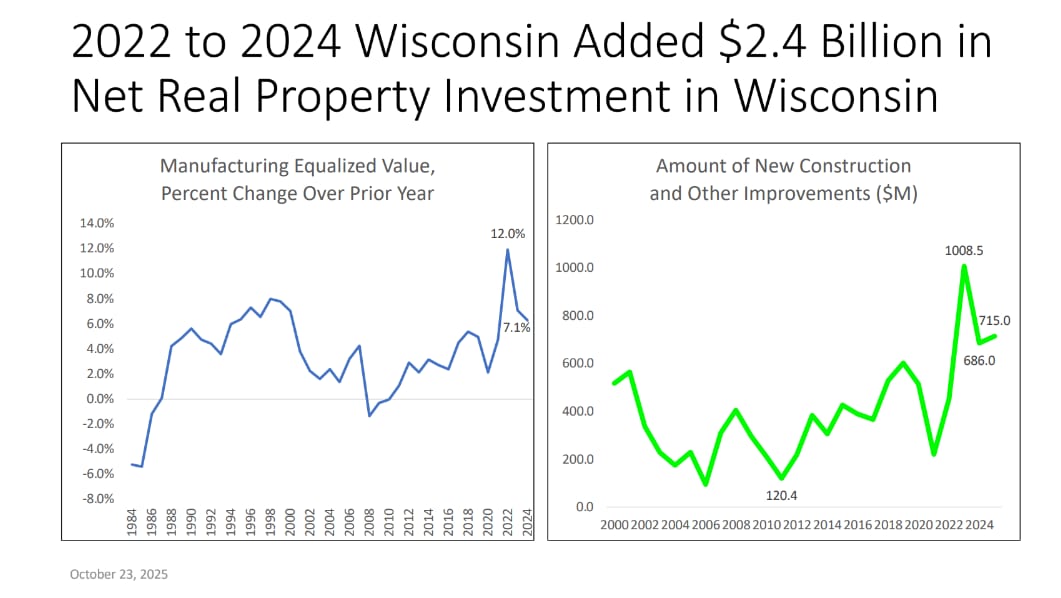
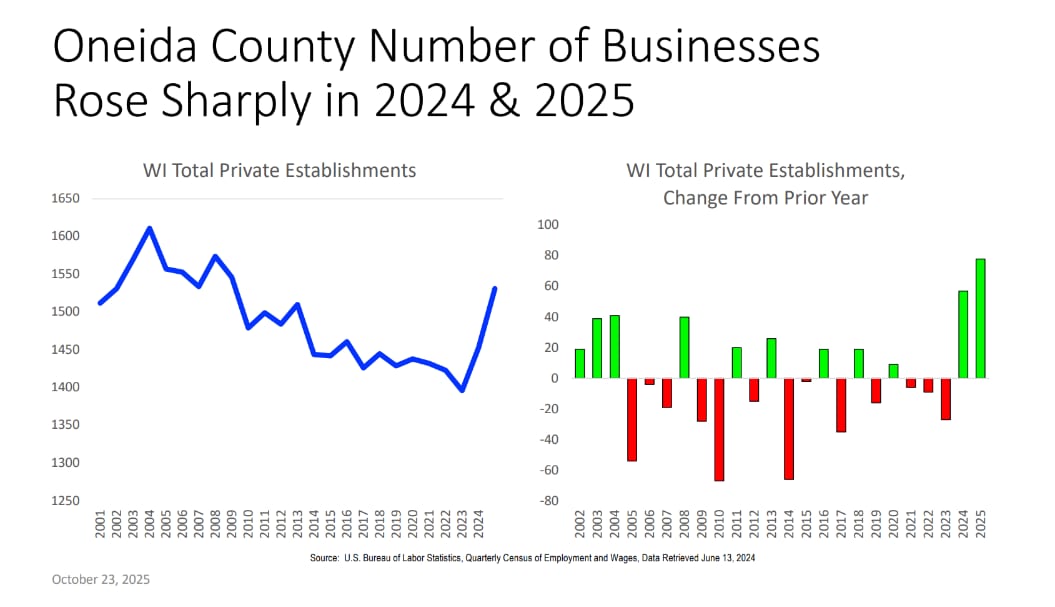
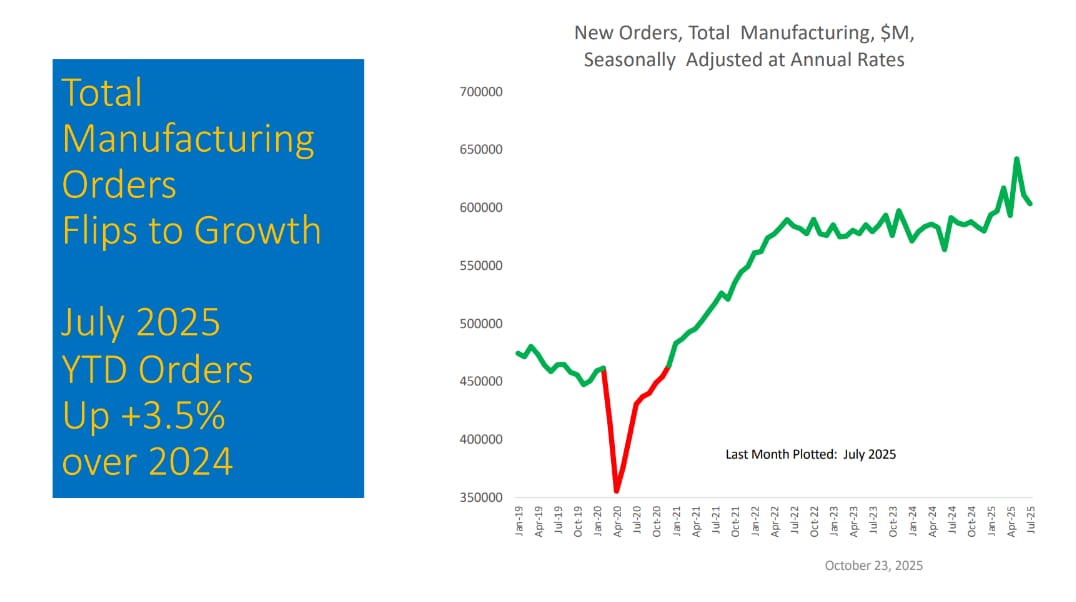
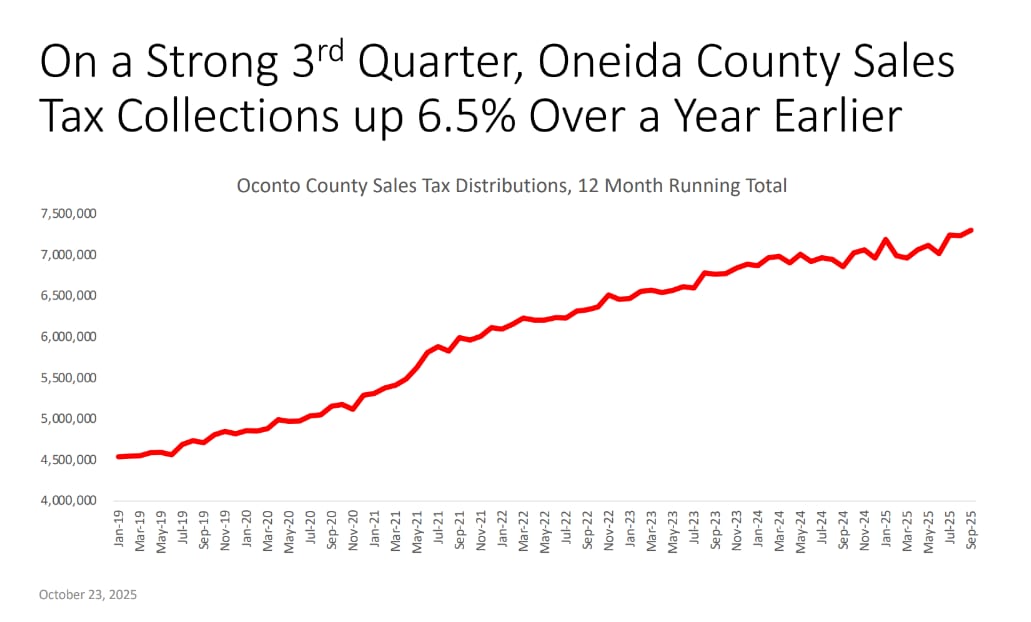
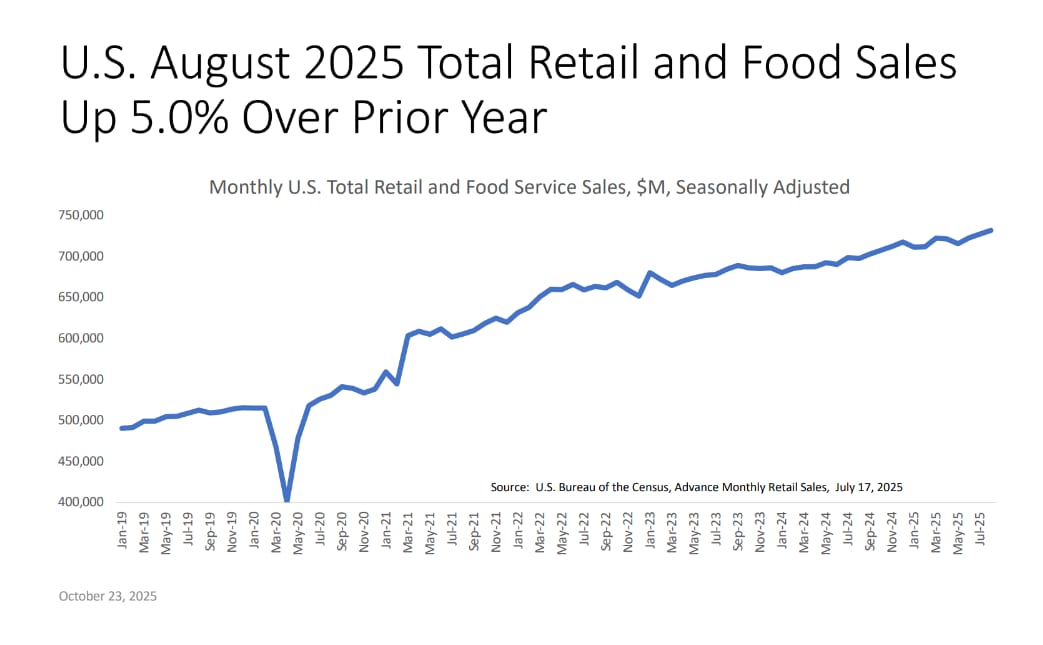
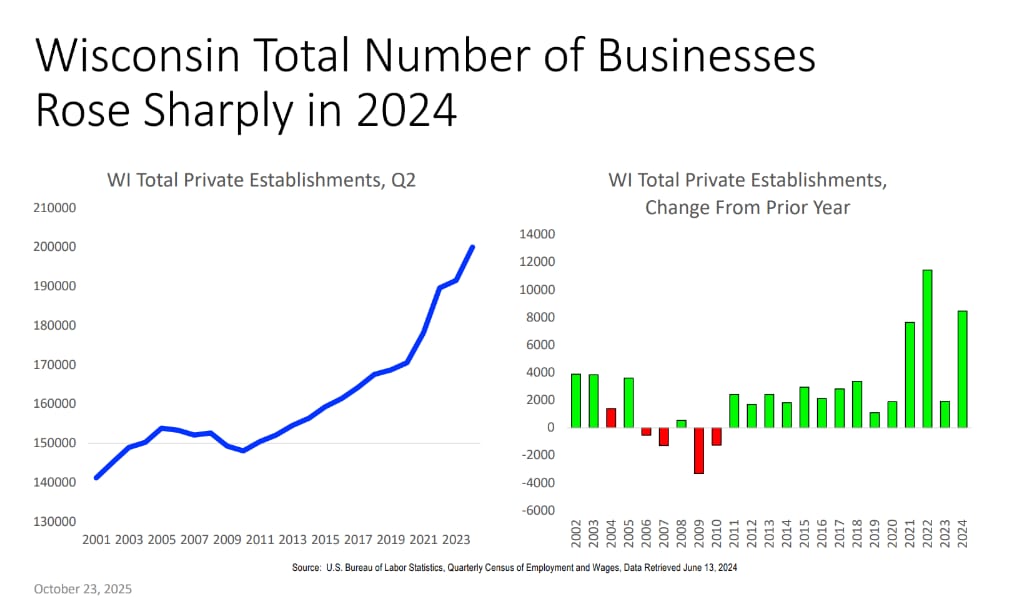
Oneida County Highlights • Employment: Steady growth with the unemployment rate at full-employment levels (around 3%). • Business Growth: The number of private business establishments rose sharply in 2024–2025, reflecting strong entrepreneurship and small business formation. • Retail Activity: County sales tax collections increased 6.5% year-over-year, signaling healthy consumer spending. • Manufacturing & Investment: Oneida benefits from Wisconsin’s broader manufacturing surge. Over $5.7 billion in statewide industrial investments are underway, including projects in food processing, chemicals, and industrial equipment. • Housing: Property values rose 8.3% statewide, and Wisconsin ranks 8th in national home price appreciation. Oneida County remains more affordable than national averages.
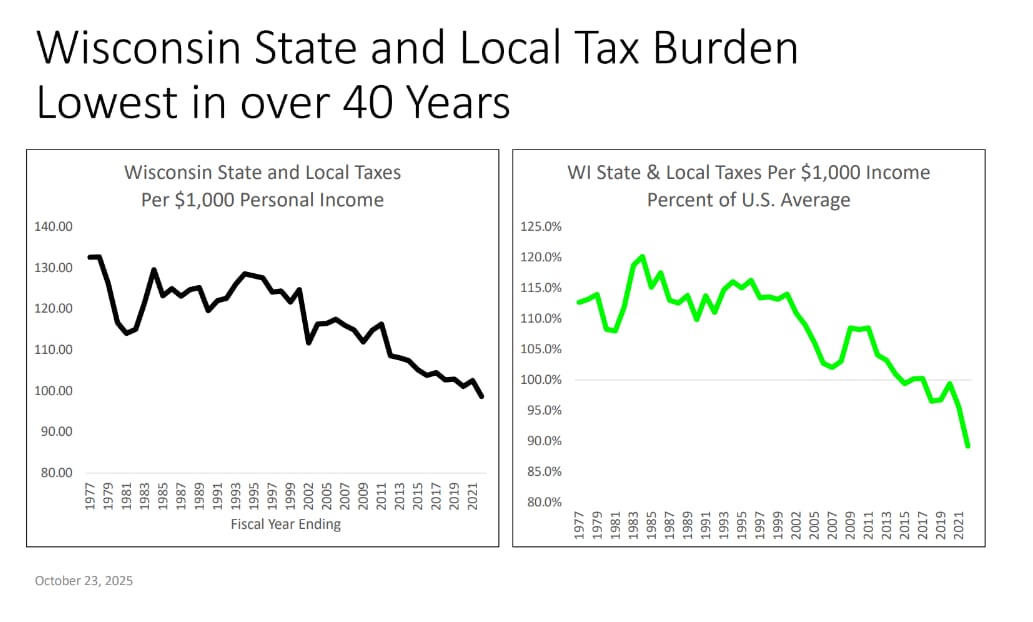
Fiscal and Tax Competitiveness • Wisconsin’s state and local tax burden is the lowest in 40 years, ranking 35th in tax per personal income. • The business personal property tax was fully eliminated in 2024, further enhancing competitiveness. • Additional tax cuts for 2025–27 target income and sales taxes.
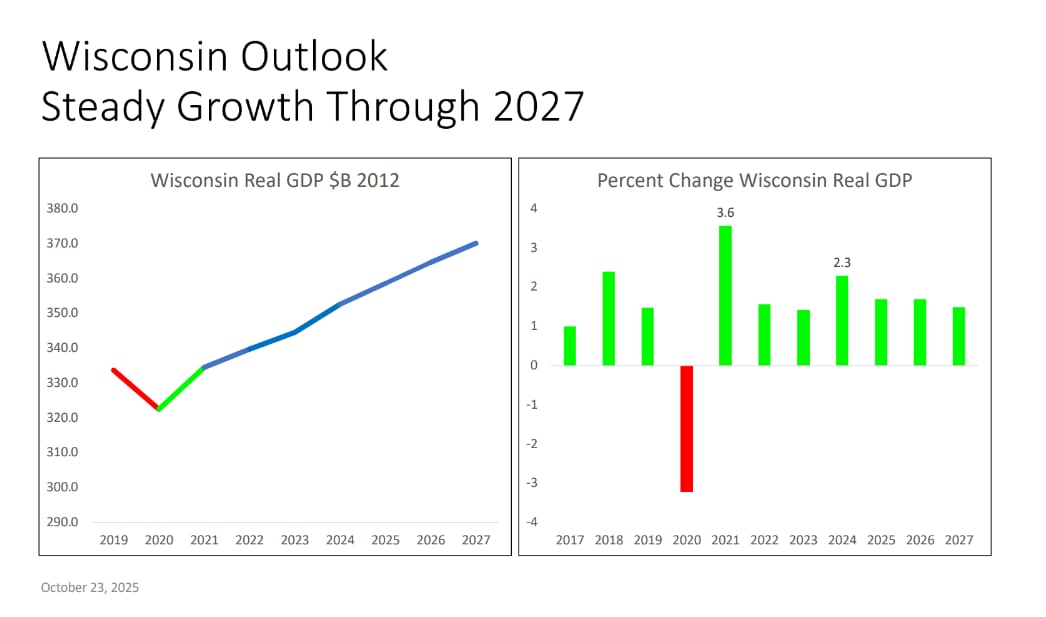
Outlook (2025–2027) • GDP Growth: Wisconsin projected to grow steadily at 2–3% annually. • Unemployment: Expected to remain near historic lows. • Inflation: Moderate and stable. • Business & Investment Climate: Continued growth in manufacturing, housing, and entrepreneurship.
**In summary:**Oneida County enters 2025 with strong economic fundamentals, low unemployment, rising employment and business creation, and robust consumer activity. Wisconsin’s prudent fiscal policies, expanding manufacturing base, and growing population position both the state and county for continued, steady growth through 2027.
Information & Photos provided by The WI Department of Revenue - October 22nd, 2025.
More announcements
View all →
Small Business Office Hours: Free Consulting for Oneida County Businesses
Get free, confidential business consulting at OCEDC to help your Oneida County business grow and succeed.
Read more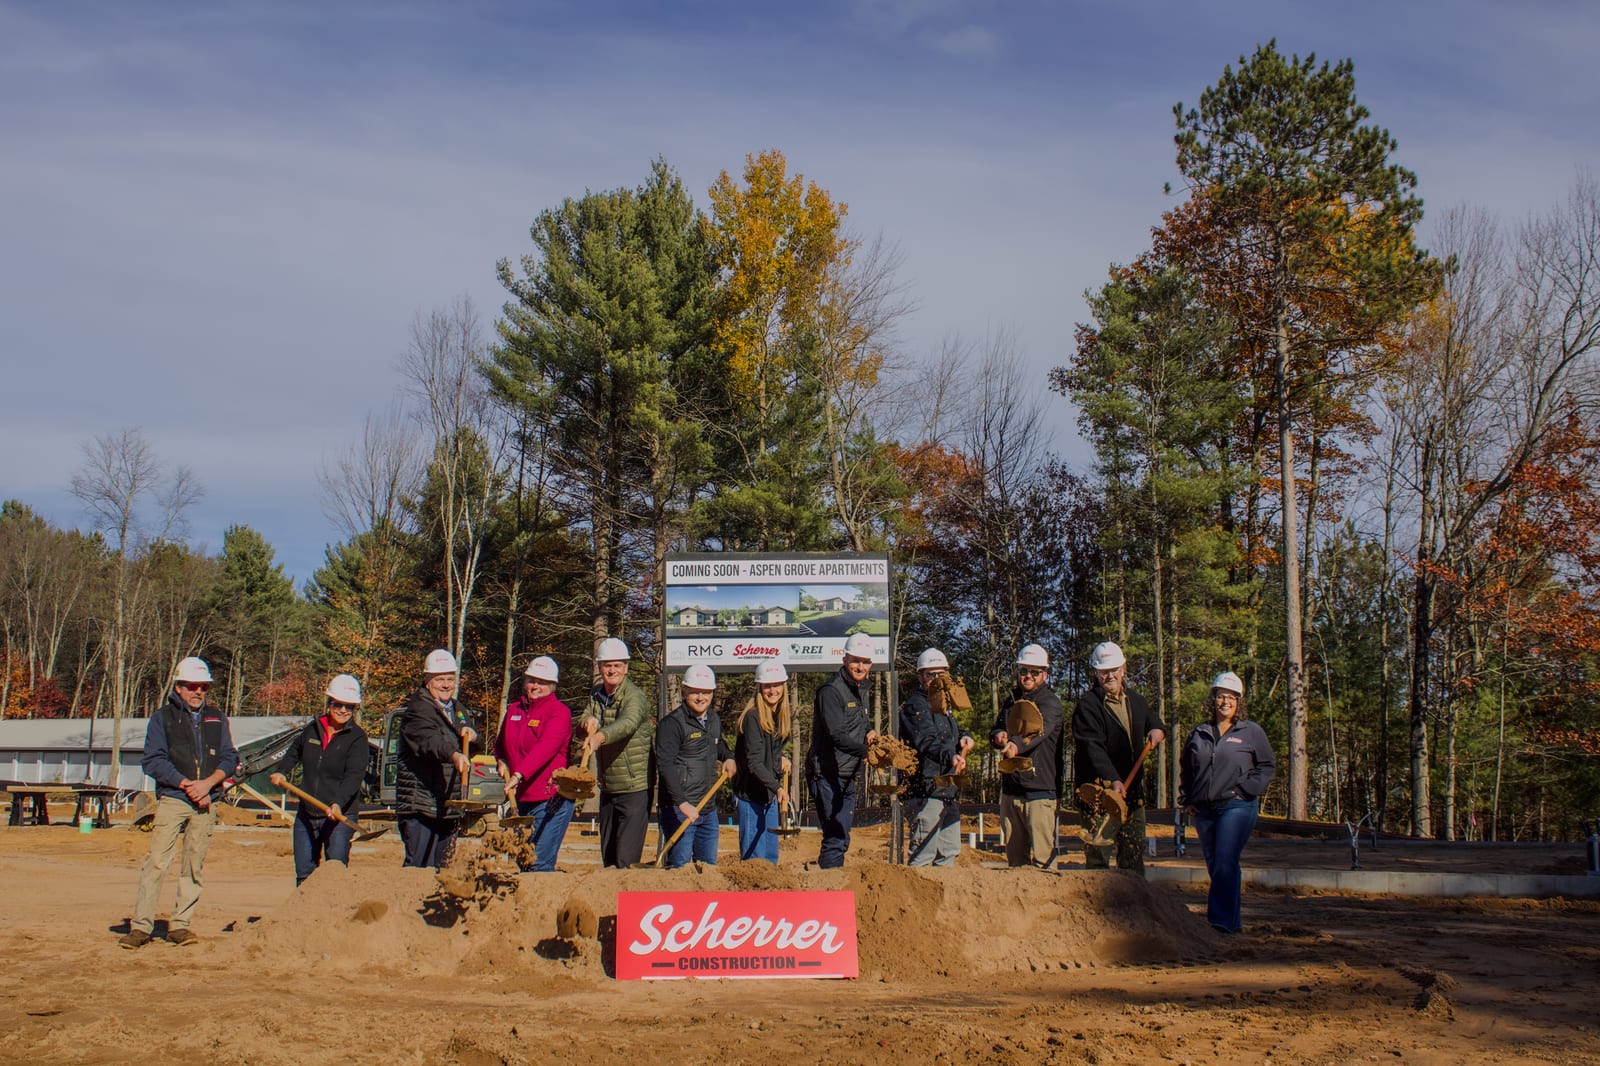
Aspen Grove Apartments Breaks Ground, Expanding Local Housing Choices
Aspen Grove Apartments brings 112 new homes to Oneida County, opening fresh opportunities for residents and local businesses.
Read more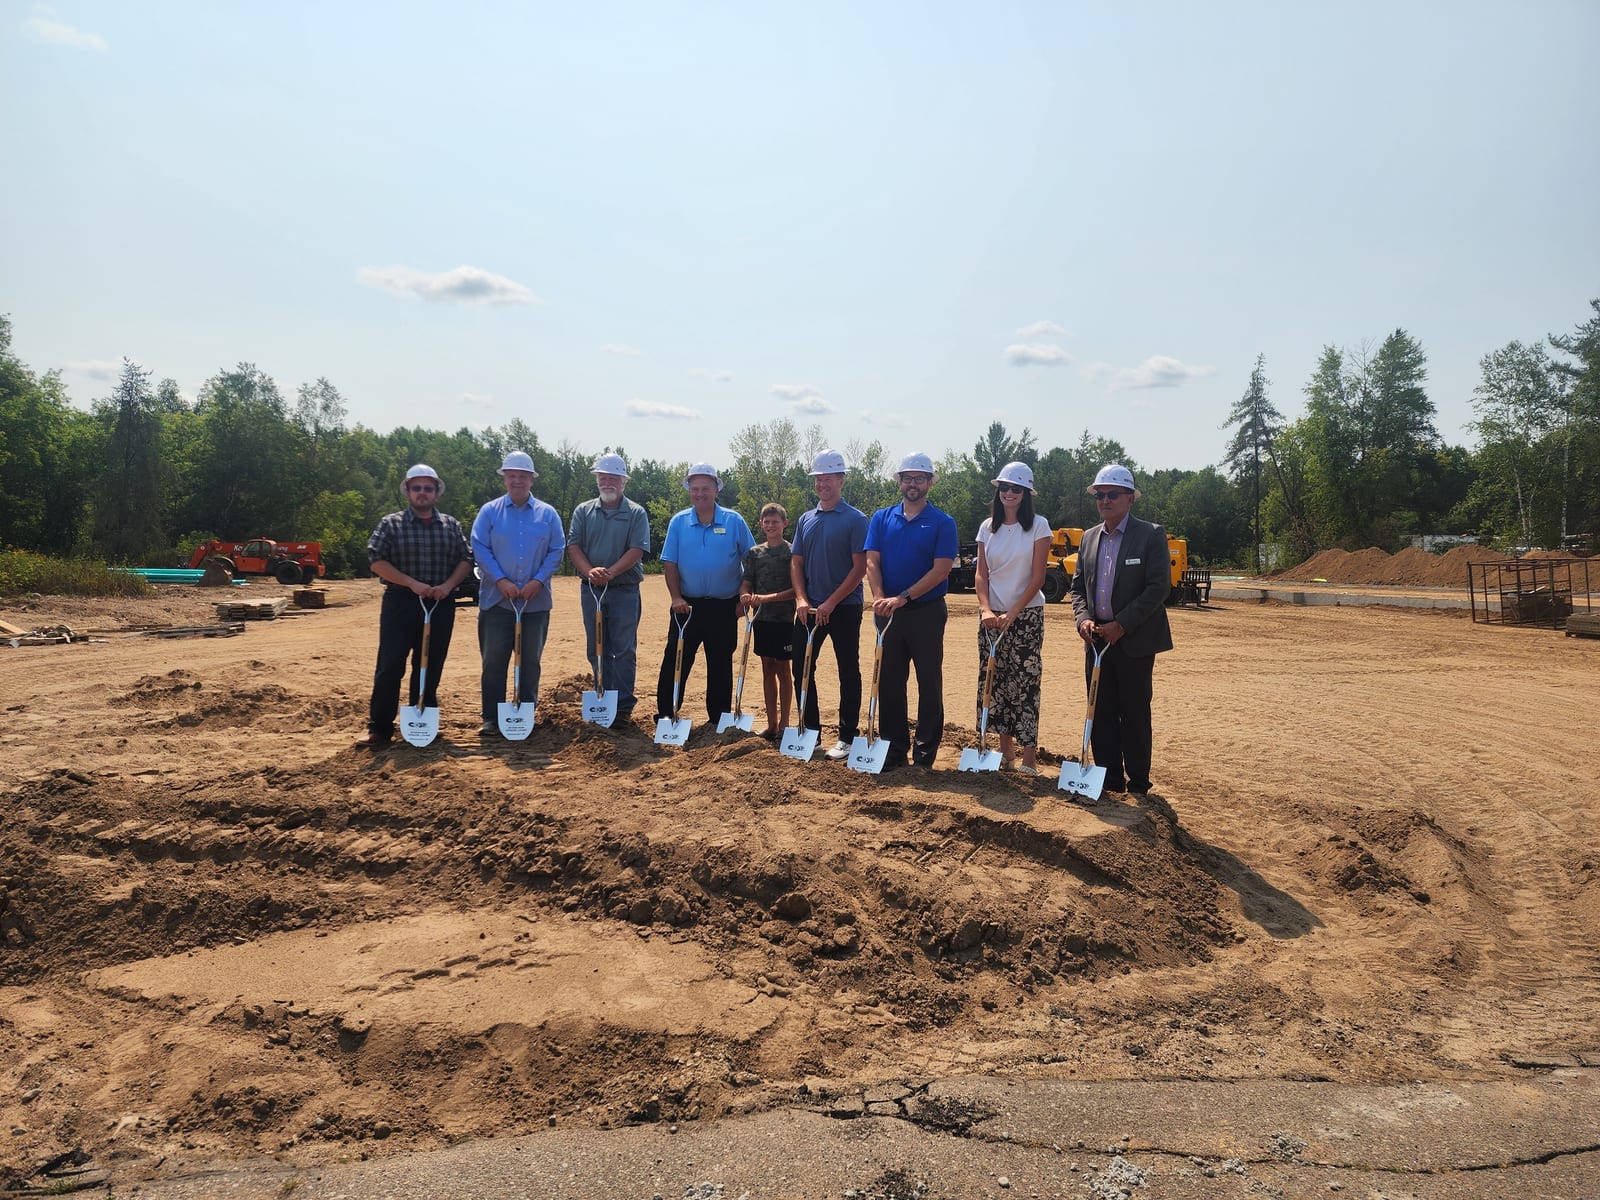
Riverview Senior Housing Breaks Ground in Rhinelander
Riverview Senior Housing’s groundbreaking marks major progress in community-focused housing for Oneida County seniors and veterans.
Read more